Interpreting Indicator Details
The Indicator Details page provides a comprehensive view of a specific indicator, including its connection to the Theory of Change, key metrics, and progress visualization. This page helps users understand the indicator's status and performance over time.
Page Structure
The Indicator Details page is divided into the following sections:
1. Theory of Change Details
Displays information about the Theory of Change linked to the indicator.
- Title: The name of the Theory of Change.
- Description: A brief overview of the Theory of Change.
By Default This Section is collapsed, you can always click on the accordion to expand it.

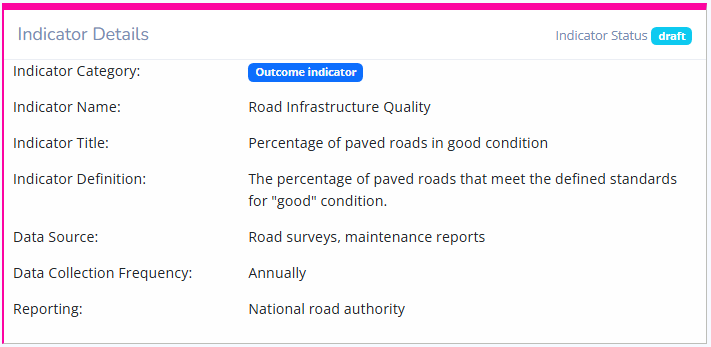
2. Indicator Details
Provides specific details about the selected indicator.
-
Indicator Name: The title of the indicator being tracked.
-
Indicator Title: The Short descriptive name of the indicator.
-
Indicator Definition: A brief description of the indicator's purpose and measurement.
-
Data Source: Specifies how the data will be collected, detailing the methods and tools used to gather information.
-
Frequency: Indicates how often the data will be collected (e.g., monthly, quarterly).
-
Reporting: Mentions where the results will be reported, providing clarity on the communication of progress and outcomes.
3. Indicator Metrics
Shows important metrics used to calculate indicator's progress.
- Indicator Baseline Value: The current value of the indicator, which serves as a reference point for measuring progress.
- Indicator Target Value: The target value, indicating the desired outcome for the indicator.

4. Progress Visualization
Includes graphical representations of the indicator's progress.
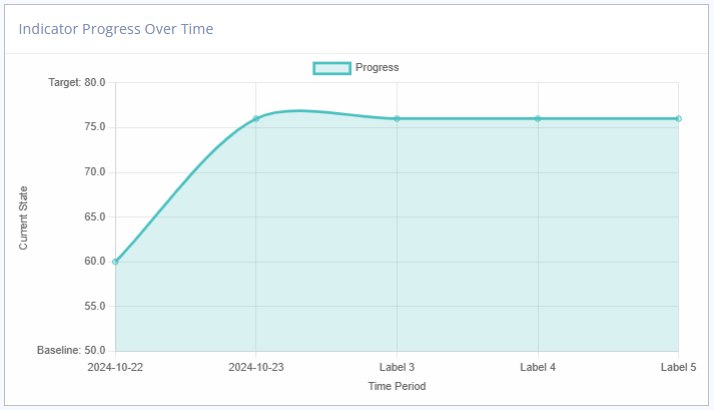
4.1 Line Graph
The line graph displays the trend of the indicator's progress over time.
- X-Axis: Shows the timeline (dates of updates).
- Y-Axis: Represents the values recorded for the indicator.
- Data Points: Plots each recorded value.
- Progress Line: Connects data points to show the trend.
Line graph for indicator with increasing progress direction
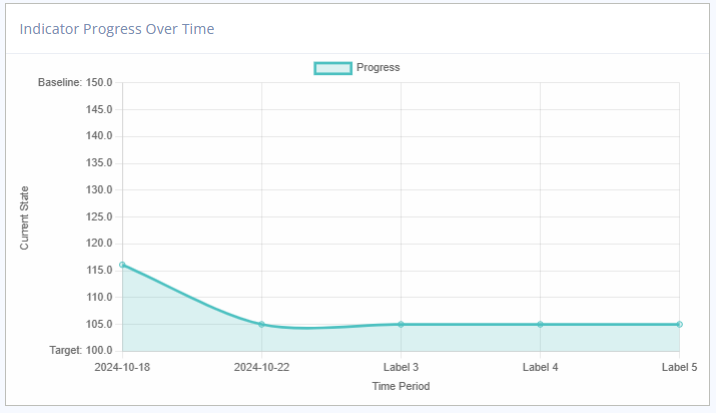
Line graph for indicator with decreasing progress direction
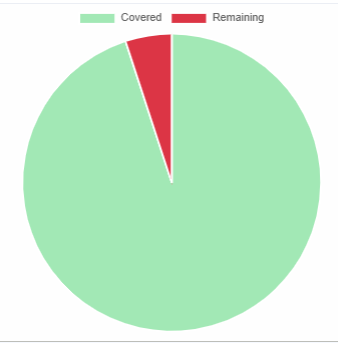
4.2 Pie Chart
The pie chart provides a visual representation of covered vs. remaining coverage.
- Covered Coverage: Shows the percentage of the target that has been reached.
- Remaining Coverage: Represents the portion left to achieve the target.